
之前有一段时间一直使用 latex 记笔记。latex 有很多的优点,写理科内容必会的东西。但是对于发布博客和高亮代码方面对程序员不太友好。latex 的包虽然很多,但是 orgmode 用 emacs 打开直接是高亮的,这一点 latex-mode 不可以做的很好,因为 latex 的格式太复杂了。
我写博客是在 emacs 下面写 org 文档,用 ox-hugo 转成 md 发布到远程服务器。但是 org-mode 画图很可方便的使用 tikz 吗?这个东西是可是文档狂魔,无敌大佬 Till Tantau 伴随 latex 一起打造的神器,他也能靠此留名青史。我真的觉得 20 世纪初德国能成为世界的数学和物理之都是因为德国人做事比较严谨。而且热衷于自然科学。
我爱德国人的古板。
https://www.luogu.com.cn/blog/over-knee-socks/TikZ-guide-1
在 latex 中是这个宏包:pgf
这是 tikz 宏包使用说明:
https://zhuanlan.zhihu.com/p/127155579
vikz 虽然写起来看着可怕(代码多),但是他能带绐人一种独特的确定性的美感。用代码画各种图。这是属于程序员的一点小情趣。比起 graphviz , ditaa 这类的图。vikz 各加无所不能,门槛就是要么使用 latex 的编辑软件,要么像 emacsers 一样能在 orgmode 中方便的使用 vikz 。这部分的内容网上几乎找不到,让我来分享一波使用方法。
安装 latex 和 pgf 宏包
这部分应该很容易,就不说了。
emacs 的 xenops-mode 配置
这个配置为了在本地写代码所见即可得,修改起来方便。
;; xenops-mode
(use-package xenops
    :config
  (setq xenops-math-image-scale-factor 1.6))

(add-hook 'latex-mode-hook #'xenops-mode)
(add-hook 'LaTeX-mode-hook #'xenops-mode)
(add-hook 'org-mode-hook #'xenops-mode)

(setq xenops-math-latex-process-alist
      '((dvipng :programs
         ("latex" "dvipng")
         :description "dvi > png" :message "you need to install the programs: latex and dvipng."
         :image-input-type "dvi" :image-output-type "png" :image-size-adjust (1.0 . 1.0)
         :latex-compiler
         ("latex -interaction nonstopmode -shell-escape -output-format dvi -output-directory %o %f")
         :image-converter
         ("dvipng -D %D -T tight -o %O %f"))
        (dvisvgm :programs
         ("latex" "dvisvgm")
         :description "xdv > svg"
         :message "you need to install the programs: latex and dvisvgm."
         :image-input-type "xdv"
         :image-output-type "svg"
         :image-size-adjust (1.2 . 1.2)
         :latex-compiler
         ("xelatex -no-pdf -interaction nonstopmode -shell-escape -output-directory %o %f")
         :image-converter
         ("dvisvgm %f -n -b min -c %S -o %O"))
        (imagemagick :programs
         ("latex" "convert")
         :description "pdf > png" :message "you need to install the programs: latex and imagemagick."
         :image-input-type "pdf" :image-output-type "png" :image-size-adjust (1.0 . 1.0)
         :latex-compiler
         ("pdflatex -interaction nonstopmode -shell-escape -output-directory %o %f")
         :image-converter
         ("convert -density %D -trim -antialias %f -quality 100 %O"))))

(setq xenops-reveal-on-entry t
      xenops-image-directory (expand-file-name "xenops/image" user-emacs-directory)
      xenops-math-latex-process 'imagemagick
      xenops-math-image-scale-factor 2
      )

;; xenops-mode 太好用了,作者真的是为人民服务啊。
(add-hook 'find-file-hook #'my-xenops-function)
(defun my-xenops-function ()
  (when (and (stringp buffer-file-name)
             (string-match "\\.org\\'" buffer-file-name))
    (xenops-render)))


;; org-mode预览公式
;; https://q3yi.me/post/4_use_xelatex_instead_of_latex_in_org_preview_latex_process/
(add-to-list 'org-preview-latex-process-alist
             '(xdvsvgm :progams
               ("xelatex" "dvisvgm")
               :discription "xdv > svg"
               :message "you need install the programs: xelatex and dvisvgm."
               :image-input-type "xdv"
               :image-output-type "svg"
               :image-size-adjust (1.7 . 1.5)
               :latex-compiler ("xelatex -interaction nonstopmode -no-pdf -output-directory %o %f")
               :image-converter ("dvisvgm %f -n -b min -c %S -o %O")))

(setq org-preview-latex-default-process 'xdvsvgm)
(setq org-latex-create-formula-image-program 'imagemagick)
xenops-mode 可以用 dvisvgm 来将 latex 编译成 svg 图像,svg 图像要比 png 图像的显示效果好,但是在 emacs 中 babel-src 的 latex 代码确不能用 dvisvgm 来显示生成的 tikz 图片,所以上面的 xenops-math-latex-process 要设置成 ‘imagemagick 。
emacs 增加 hugo 导出的 snippet
# -*- mode: snippet -*-
# name: ljtikz
# key: ljtikz
# --
#+OPTIONS: html-postamble:nil
#+HEADER: :fit yes :imagemagick yes :iminoptions -density 300
#+HEADER: :packages '("\\\\usepackage{tikz} \\\\usepackage{pgfplots} \\\\pgfplotsset{compat=newest}")
#+begin_src latex :file ltximg/${1:name} :results raw file :exports results
${2:content}
这个配置让我在本地可以用 snippet 直接写出模板,然后在 content 中进行画图。上面的配置如果只想将图片导出到博客,那上面的 export 处写 results 。如果想将 tikz 的源码也导出的话,不改成 both 。
如果缺哪个设置就加 tikzpicture 的代码中,例如:
\begin{tikzpicture}
   \usetikzlibrary{patterns}
...
tikz
我新的分享可以用 tikz 画一些流程图和代码逻辑的图片,tikz 的英文文档有将近 1100 页。难度应该是不大的,关键是系统的学习,成本比较高。尤其是对于理解能力和学习能力比较弱的同学来说(没错,说的就是我),用哪里学哪里。哪里不会点哪里。so hard …
tikz 画图的缺点是画图效率低,优点是效果好。
https://destinyenvoy.github.io/2019/11/20/draw-pretty-fig/
https://tex.stackexchange.com/questions/450250/draw-layered-software-architecture-with-tikz
tikz 的优美例子:
tikz 的在线使用教程:
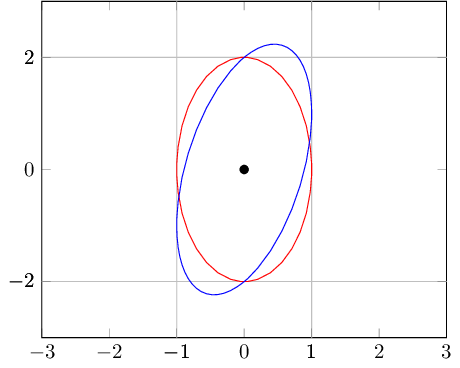
举一些例子
\begin{tikzpicture}
\begin{axis}[
    xmin=-3,   xmax=3,
    ymin=-3,   ymax=3,
    extra x ticks={-1,1},
    extra y ticks={-2,2},
    extra tick style={grid=major},
]
    \draw[red] \pgfextra{
      \pgfpathellipse{\pgfplotspointaxisxy{0}{0}}
        {\pgfplotspointaxisdirectionxy{1}{0}}
        {\pgfplotspointaxisdirectionxy{0}{2}}
      % see also the documentation of
      % 'axis direction cs' which
      % allows a simpler way to draw this ellipse
    };
    \draw[blue] \pgfextra{
      \pgfpathellipse{\pgfplotspointaxisxy{0}{0}}
        {\pgfplotspointaxisdirectionxy{1}{1}}
        {\pgfplotspointaxisdirectionxy{0}{2}}
    };
    \addplot [only marks,mark=*] coordinates { (0,0) };
\end{axis}
\end{tikzpicture}
\begin{tikzpicture}
%\draw (0,0) -- (1,0) -- (1,1) -- cycle;
\tikz \draw[thick,rounded corners=8pt]
(0,0) -- (0,2) -- (1,3.25) -- (2,2) -- (2,0) -- (0,2) -- (2,2) -- (0,0) -- (2,0);
\end{tikzpicture}

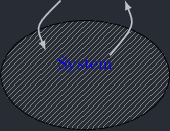
\begin{tikzpicture}
   \usetikzlibrary{patterns}
   %\draw[->] (-3,0) -- (-2,0) arc[radius=0.5cm,start angle=-180,end angle=0] (-1,0) -- (1,0) arc[radius=0.5cm,start angle=180,end angle=0] (2,0) -- (3,0);
   \draw[black,thin, pattern=north east lines, pattern color=gray] (0,0) ellipse (1.7cm and 1.1cm);
   \draw[-latex, thick] (0.5,0.4).. controls (1,1)  .. (0.8,1.5);
   \draw[-latex, thick] (-0.5,1.5).. controls (-1,1)  .. (-0.8,0.5);
   \node[text=blue] at (0,0.2) {System};
\end{tikzpicture}
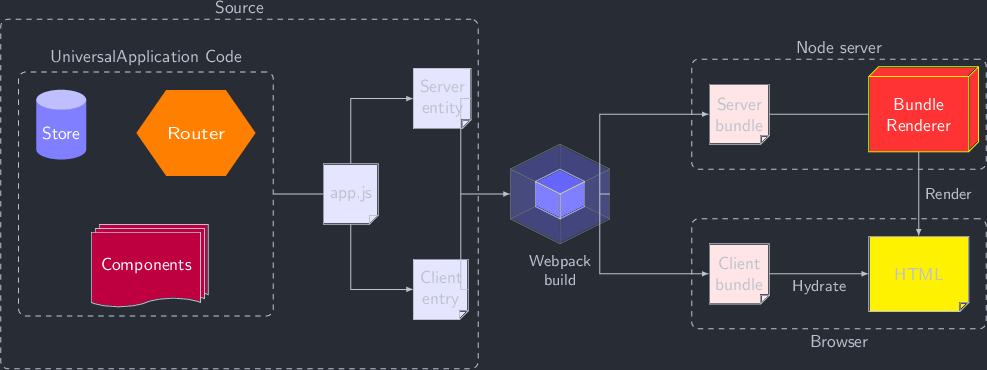
%\begin{tikzpicture}[background rectangle/.style={fill=white}, show background rectangle, scale=0.4]
  \begin{tikzpicture}[scale=0.4]
  \usetikzlibrary{shapes.geometric,shapes.symbols,fit,positioning,shadows}
  \usetikzlibrary{backgrounds}
  % https://tex.stackexchange.com/a/12039/121799
  \makeatletter
  \pgfkeys{/pgf/.cd,
    parallelepiped offset x/.initial=2mm,
    parallelepiped offset y/.initial=2mm
  }
  \pgfdeclareshape{parallelepiped}
  {
    \inheritsavedanchors[from=rectangle] % this is nearly a rectangle
    \inheritanchorborder[from=rectangle]
    \inheritanchor[from=rectangle]{north}
    \inheritanchor[from=rectangle]{north west}
    \inheritanchor[from=rectangle]{north east}
    \inheritanchor[from=rectangle]{center}
    \inheritanchor[from=rectangle]{west}
    \inheritanchor[from=rectangle]{east}
    \inheritanchor[from=rectangle]{mid}
    \inheritanchor[from=rectangle]{mid west}
    \inheritanchor[from=rectangle]{mid east}
    \inheritanchor[from=rectangle]{base}
    \inheritanchor[from=rectangle]{base west}
    \inheritanchor[from=rectangle]{base east}
    \inheritanchor[from=rectangle]{south}
    \inheritanchor[from=rectangle]{south west}
    \inheritanchor[from=rectangle]{south east}
    \backgroundpath{
      % store lower right in xa/ya and upper right in xb/yb
      \southwest \pgf@xa=\pgf@x \pgf@ya=\pgf@y
      \northeast \pgf@xb=\pgf@x \pgf@yb=\pgf@y
      \pgfmathsetlength\pgfutil@tempdima{\pgfkeysvalueof{/pgf/parallelepiped offset x}}
      \pgfmathsetlength\pgfutil@tempdimb{\pgfkeysvalueof{/pgf/parallelepiped offset y}}
      \def\ppd@offset{\pgfpoint{\pgfutil@tempdima}{\pgfutil@tempdimb}}
      \pgfpathmoveto{\pgfqpoint{\pgf@xa}{\pgf@ya}}
      \pgfpathlineto{\pgfqpoint{\pgf@xb}{\pgf@ya}}
      \pgfpathlineto{\pgfqpoint{\pgf@xb}{\pgf@yb}}
      \pgfpathlineto{\pgfqpoint{\pgf@xa}{\pgf@yb}}
      \pgfpathclose
      \pgfpathmoveto{\pgfqpoint{\pgf@xb}{\pgf@ya}}
      \pgfpathlineto{\pgfpointadd{\pgfpoint{\pgf@xb}{\pgf@ya}}{\ppd@offset}}
      \pgfpathlineto{\pgfpointadd{\pgfpoint{\pgf@xb}{\pgf@yb}}{\ppd@offset}}
      \pgfpathlineto{\pgfpointadd{\pgfpoint{\pgf@xa}{\pgf@yb}}{\ppd@offset}}
      \pgfpathlineto{\pgfqpoint{\pgf@xa}{\pgf@yb}}
      \pgfpathmoveto{\pgfqpoint{\pgf@xb}{\pgf@yb}}
      \pgfpathlineto{\pgfpointadd{\pgfpoint{\pgf@xb}{\pgf@yb}}{\ppd@offset}}
    }
  }
  % https://tex.stackexchange.com/a/103691/121799
  \pgfdeclareshape{document}{
    \inheritsavedanchors[from=rectangle] % this is nearly a rectangle
    \inheritanchorborder[from=rectangle]
    \inheritanchor[from=rectangle]{center}
    \inheritanchor[from=rectangle]{north}
    \inheritanchor[from=rectangle]{north east}
    \inheritanchor[from=rectangle]{north west}
    \inheritanchor[from=rectangle]{south}
    \inheritanchor[from=rectangle]{south east}
    \inheritanchor[from=rectangle]{south west}
    \inheritanchor[from=rectangle]{west}
    \inheritanchor[from=rectangle]{east}
    \backgroundpath{%
      \southwest \pgf@xa=\pgf@x \pgf@ya=\pgf@y
      \northeast \pgf@xb=\pgf@x \pgf@yb=\pgf@y
      \pgf@xc=\pgf@xb \advance\pgf@xc by-5pt % this should be a parameter
      \pgf@yc=\pgf@ya \advance\pgf@yc by5pt
      \pgfpathmoveto{\pgfpoint{\pgf@xa}{\pgf@ya}}
      \pgfpathlineto{\pgfpoint{\pgf@xa}{\pgf@yb}}
      \pgfpathlineto{\pgfpoint{\pgf@xb}{\pgf@yb}}
      \pgfpathlineto{\pgfpoint{\pgf@xb}{\pgf@yc}}
      \pgfpathlineto{\pgfpoint{\pgf@xc}{\pgf@ya}}
      \pgfpathclose
      % add little corner
      \pgfpathmoveto{\pgfpoint{\pgf@xc}{\pgf@ya}}
      \pgfpathlineto{\pgfpoint{\pgf@xc}{\pgf@yc}}
      \pgfpathlineto{\pgfpoint{\pgf@xb}{\pgf@yc}}
      \pgfpathclose
    }
  }
  \makeatother

  \tikzset{doc/.style={document,fill=blue!10,draw,thin,minimum
      height=1.2cm,align=center},
    pics/.cd,
    pack/.style={code={%
        \draw[fill=blue!50,opacity=0.2] (0,0) -- (0.5,-0.25) -- (0.5,0.25) -- (0,0.5) -- cycle;
        \draw[fill=blue!50,opacity=0.2] (0,0) -- (-0.5,-0.25) -- (-0.5,0.25) -- (0,0.5) -- cycle;
        \draw[fill=blue!60,opacity=0.2] (0,0) -- (-0.5,-0.25) -- (0,-0.5) -- (0.5,-0.25) -- cycle;
        \draw[fill=blue!60] (0,0) -- (0.25,0.125) -- (0,0.25) -- (-0.25,0.125) -- cycle;
        \draw[fill=blue!50] (0,0) -- (0.25,0.125) -- (0.25,-0.125) -- (0,-0.25) -- cycle;
        \draw[fill=blue!50] (0,0) -- (-0.25,0.125) -- (-0.25,-0.125) -- (0,-0.25) -- cycle;
        \draw[fill=blue!50,opacity=0.2] (0,-0.5) -- (0.5,-0.25) -- (0.5,0.25) -- (0,0) -- cycle;
        \draw[fill=blue!50,opacity=0.2] (0,-0.5) -- (-0.5,-0.25) -- (-0.5,0.25) -- (0,0) -- cycle;
        \draw[fill=blue!60,opacity=0.2] (0,0.5) -- (-0.5,0.25) -- (0,0) -- (0.5,0.25) -- cycle;
      }}}

  \resizebox {\textwidth} {!}{
    [font=\sffamily,every label/.append
    style={font=\small\sffamily,align=center}]
    \node[cylinder, cylinder uses custom fill, cylinder end fill=blue!25,
    cylinder body fill=blue!50,shape border rotate=90,text=white,
    aspect=0.4,minimum width=1cm,minimum height=1.4cm](Store){Store};
    \node[right=1cm of Store,regular polygon,regular polygon sides=6,fill=orange,
    xscale=1.2,text=white] (Router) {Router};
    \node[fit=(Store) (Router)](fit1){};
    \node[below=1cm of fit1,tape, draw,thin, tape bend top=none,fill=purple,
    text=white,minimum width=2.2cm,double copy shadow,minimum height=1.5cm]
    (Components) {Components};
    \node[draw,dashed,rounded corners,fit=(Store) (Router) (Components),inner
    sep=10pt,label={above:{Universal\\ Application Code}}](fit2){};
    \node[right=1cm of fit2,doc] (js) {app.js};
    \node[above right=1cm of js,doc] (Server) {Server\\ entity};
    \node[below right=1cm of js,doc] (Client) {Client\\ entry};
    \draw(fit2.east) -- (js);
    \draw[-latex] (js) |- (Server);
    \draw[-latex] (js) |- (Client);
    \draw[-] (Client) -- ++ (1,0) |- (Server) coordinate[pos=0.25] (aux1);
    \node[draw,dashed,rounded corners,fit=(fit2) (aux1),inner
    xsep=10pt,inner ysep=30pt,label={above:{Source}}](fit3){};

    \pic[right=2cm of aux1,local bounding box=Webpack,scale=2] (Webpack) {pack};
    \node[below=1mm of Webpack,font=\small\sffamily,align=center]{Webpack\\ build};

    \node[above right=1cm and 2cm of Webpack.east,doc,fill=red!10] (ServerBundle)
    {Server\\ bundle};
    \node[below right=1cm and 2cm of Webpack.east,doc,fill=red!10] (ClientBundle) {Client\\
      bundle};
    \node[right=2cm of ServerBundle,parallelepiped,draw=yellow,fill=red!80,
    minimum width=2cm,minimum height=1.5cm,align=center,text=white]
    (BundleRenderer)   {Bundle\\ Renderer};
    \node[right=2cm of ClientBundle,doc,fill=yellow,minimum width=2cm,minimum height=1.5cm] (HTML) {HTML};
    \draw[-latex] (aux1) -- (Webpack);
    \draw[-latex] (Webpack) -- ++ (2,0) coordinate(aux2) |- (ServerBundle);
    \draw[-latex] (aux2) |- (ClientBundle);
    \draw[-latex] (ClientBundle) -- (HTML) node[midway,below,font=\small\sffamily]{Hydrate};
    \draw (ServerBundle) -- (BundleRenderer);
    \draw[-latex] (BundleRenderer) -- (HTML) node[midway,right,font=\small\sffamily]{Render};

    \node[draw,dashed,rounded corners,fit=(ServerBundle) (BundleRenderer),inner
    sep=10pt,label={above:{Node server}}](fit4){};
    \node[draw,dashed,rounded corners,fit=(ClientBundle) (HTML),inner
    sep=10pt,label={below:{Browser}}](fit5){};
  }
\end{tikzpicture}
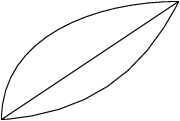
\begin{tikzpicture}
  \draw (0,0) to (3,2);
  \draw (0,0) to[out=90,in=180] (3,2);
  \draw (0,0) to[bend right] (3,2);
\end{tikzpicture}
下面是一个中文的示例,这个例子之所以可以导出中文是因为 HEADER 的设置增加了 \usepackage{fontspec} ,并在代码中设置了 font ,并且 HEADER 中指定使用 imagemagick 进行导出,代码中也设置了中文字体:
\begin{tikzpicture}[
  rec/.style={rectangle, thick,minimum width=1.5cm,minimum height=0.5cm,text centered,draw=#1,fill=#1!15,UTF8},
  arrow/.style={ ->,>=stealth,very thick,red!80!black},
  ]
  \setmainfont{FandolSong-Regular.otf}
  \node(rec1)     [rec=blue]                          {现实问题};
  \node(rec2)     [rec=purple,right = of rec1]        {数学模型};
  \node(rec3)     [rec=green,right = of rec2]         {数学结论};
  \node(rec4)     [rec=orange,right = of rec3]        {解释 \& 预测};
  \draw[arrow]   (rec1)  --node[above]{建模}    (rec2);
  \draw[arrow]   (rec2)  --node[above]{求解}    (rec3);
  \draw[arrow]   (rec3)  --node[above]{解释}    (rec4);
  \draw[arrow]   (rec4.south)--($(rec4.south)+(0,-1)$)
  --node[above]{检验}  ($(rec1.south)+(0,-1cm)$)
  -- (rec1.south);
\end{tikzpicture}
总结
用 orgmode 来画 tikz 有很多的 hack trick 。画画时序图还比较简单。想用好确实有陡峭的学习曲线。但是做为最高级的解决方案,tikz 还是值得学习的,因为学会了这个某种程度上就学会了用代码对图片的精准操控。
orgmode 和 latex 就像是搭积木,上面的图形并没有达到在网页中展示的比较完美的效果,在 https://tex.stackexchange.com/ 里面有很多人问问题,从零开始写一个东西还是比较难的,有比较闲的时间才能弄。到此为止。烦。